New Tools and Methods Work to Integrate Solar on Local Circuits
The Story In Brief
How much solar generation can the grid handle? Using new EPRI tools and methods, utilities can better understand and manage distributed solar—and navigate a changing grid landscape.
In 2015, the International Energy Agency (IEA) expects grid-connected photovoltaic (PV) generation to meet about 1% of annual global electricity demand. This may not seem like much progress since 1954, when scientists at Bell Laboratories demonstrated the world’s first practical PV cell by harnessing sunlight to propel a miniature toy Ferris wheel. But that 1%, or 237 billion kilowatt-hours of intermittent solar electricity, is roughly equal to California’s current power generation from all sources—and IEA projects this production to more than double by 2020.
Much of PV’s rapid emergence occurred during the past decade. Of the 177 gigawatts of PV connected to global power grids at the start of this year, 98% came into service after 2004. Italy, Greece, and Germany relied on PV to meet between 7 and 8% of their electricity use in 2014, according to IEA. In the United States, PV’s share nationally remains under 1%, but states such as California, Arizona, New Jersey, and Hawaii have crossed the 1% threshold.
Notwithstanding its gains, PV risks becoming a victim of its own success unless emerging technical challenges are addressed. Key concerns relate to small-scale PV connected to local distribution circuits, or feeders, originally configured for one-way power flow from central station power plants through substations to utility customers. Today, millions of customers with on-site PV systems send electrons in the other direction, requiring network operators to manage two-way power flows and associated impacts.
On certain feeders in Germany, California, and Hawaii, solar generation exceeds demand, prompting some utilities to limit new installations and curtail output from existing ones. Such actions—driven by concerns regarding the affected feeders’ and the grid’s technical ability to manage power flows from local concentrations of distributed solar installations—have led to conflicts among grid operators, solar development companies, and customers.
Tools for the Grid’s Cutting Edge
These developments raise important questions for the grid as a whole and for particular feeders: How much distributed solar can be integrated effectively? What are the optimal locations and configurations for this solar? Since 2009, EPRI has been developing advanced tools and methods to better understand and manage distributed PV, helping utilities meet the challenges of the distribution grid’s changing landscape.
This research is a critical facet of EPRI’s Integrated Grid concept, which seeks to tap the full potential of distributed energy resources by incorporating them into grid planning and operations. When distributed resources are integrated effectively, utilities should be able to improve distribution system efficiency and defer costly infrastructure upgrades.
“Many utilities are asking, ‘When and where are we going to have problems? What penetration level can we support without issues?’ This line of questioning drove the launch of this research,” said Jeff Smith, EPRI program manager. “We want to help utilities determine how much PV their feeders and distribution systems can host, as well as the best locations and configurations for that solar to optimize its integration into the grid. These insights will enable them to improve their screening of PV interconnection requests.”
Supported by more than a dozen utilities and the U.S. Department of Energy, EPRI’s analysis of feeder hosting capacity for PV is built on an expanding pool of detailed solar and electrical data from feeders across the United States. EPRI developed and deployed remote monitoring systems to collect the data—such as solar irradiance, panel temperature, and power output—in one-second intervals. This captures much greater detail than existing hourly monitoring systems and provides a more accurate picture of solar power’s characteristics, such as its variability due to moving clouds.
“With this high resolution, we are characterizing the details and the variability,” said Smith, adding that the data have attracted the attention of utilities, solar companies, researchers, and the public. EPRI created a public website with continuously updated information on the project.
Several hundred monitoring systems are gathering data on 35 feeders in the geographically diverse service territories of Consolidated Edison, FirstEnergy, National Grid, Progress Energy, Salt River Project, San Diego Gas & Electric, Southern Company, and others. Many of the monitored PV sites are single-module systems installed on utility poles specifically for the research, while others are previously completed grid-connected systems.
In the Southeast, approximately 100 units are installed in the service territories of Southern Company subsidiaries Georgia Power and Alabama Power. Southern Company’s interest in the project stems in part from the region’s heat and humidity, which cause more clouds and variability in PV output than in other regions.
Detailed Feeder Analyses
Using these data and OpenDSS, EPRI’s open-source distribution system software that simulates circuits, EPRI researchers and utility distribution planners and engineers have analyzed the hosting capacity of the 35 feeders. Each detailed analysis characterizes various potential impacts of distributed solar that could limit its reach on a feeder. “The most critical impacts are with voltage and system protection,” said Smith.
Fluctuating solar output can change a feeder’s voltage faster than regulation equipment can respond, shifting voltage above or below operating limits. In a related project, EPRI is examining the potential of smart inverters to regulate voltage and extend feeder hosting capacity (see sidebar). System protection impacts include disruptions in the coordination of protective devices as well as unintentional islanding—when distributed generators continue operating during a power outage, potentially endangering customers and utility workers.
Each analysis factors those variables that can impact hosting capacity, such as the feeder’s construction design and operating characteristics, and the location and type of PV systems, including small and large rooftop arrays and ground-mounted power plants. “In the 35 feeders we have examined to date, there is a wide disparity in hosting capacity, ranging from less than 10 percent of peak load in some cases to more than 100 percent in others,” said Smith.
Depending on the PV-related variables, a given feeder can have a range of possible hosting capacities, with minimum and maximum values. As a result, there is no simple answer to the questions, how much distributed PV can the grid handle, and how much can individual feeders handle?
The PV variables also explain why feeders with similar characteristics may have different hosting capacities. For example, EPRI analyzed two similar feeders with minimum hosting capacities of 30% and 16% of peak load. If PV deployment on these feeders were to reach their minimum capacity thresholds, the feeders could still accommodate more PV, depending on the location, size, and configuration of the units.
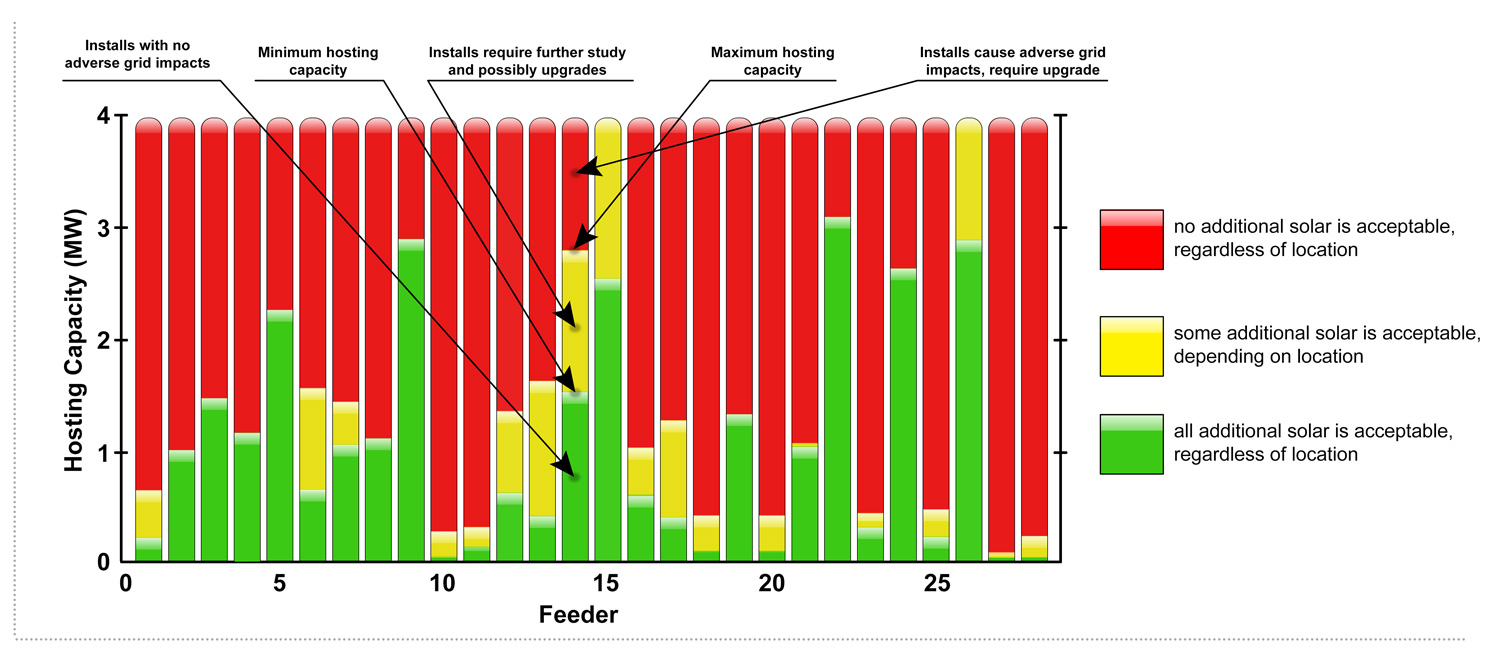
For each grid impact under investigation, EPRI’s detailed feeder analysis grouped millions of possible PV deployment scenarios into three categories:
- Deployments within a minimum hosting capacity, with no adverse grid impacts expected
- Deployments requiring further study and possibly system upgrades, depending on location, size, and configuration of PV units
- Deployments beyond maximum hosting capacity, with adverse grid impacts expected
The participating utilities are using the analyses to support PV interconnection studies and distributed resource mapping and modeling.
EPRI’s analyses reveal that there is no simple rule of thumb for determining feeder hosting capacity. This conclusion calls into question the Federal Energy Regulatory Commission’s so-called 15 percent rule, which says that PV systems can connect to the grid without interconnection studies as long as aggregrate distributed generation on a feeder does not exceed 15% of its annual peak demand. In 2014, this rule was updated to allow for projects sized 2 megawatts or smaller to connect to circuits without studies if aggregate distributed generation does not exceed 100% of peak demand. Such one-size-fits-all thresholds may not align with actual hosting capacities for specific feeders.
Streamlined Distribution System Analysis
Last year, EPRI developed a streamlined methodology to quickly analyze hosting capacity for an entire distribution system. By extrapolating key findings from detailed feeder analyses, such as optimal locations for PV, the streamlined method equips utilities to estimate hosting capacity for thousands of feeders in a distribution system. When incorporated into utility planning software, it can analyze a feeder’s hosting capacity in just minutes, compared with weeks required for the detailed approach. It is meant to complement, rather than replace, detailed analysis, helping to identify when the latter is needed.
Several utilities are using the streamlined method. For example, EPRI is customizing a streamlined approach for planning engineers at Salt River Project to evaluate all of the Arizona utility’s feeders.
Given the growth of distributed solar, such plans may become the state-of-the-art in other states as these hosting capacity tools are used more widely. EPRI has launched a new initiative to help utilities apply the tools for system-wide analysis and incorporate them into their planning software.
Key EPRI Technical Experts:
Jeff Smith, Tom Key
If you would like to contact the technical staff for more information, send your inquiry to techexpert@eprijournal.com.
Further resources: